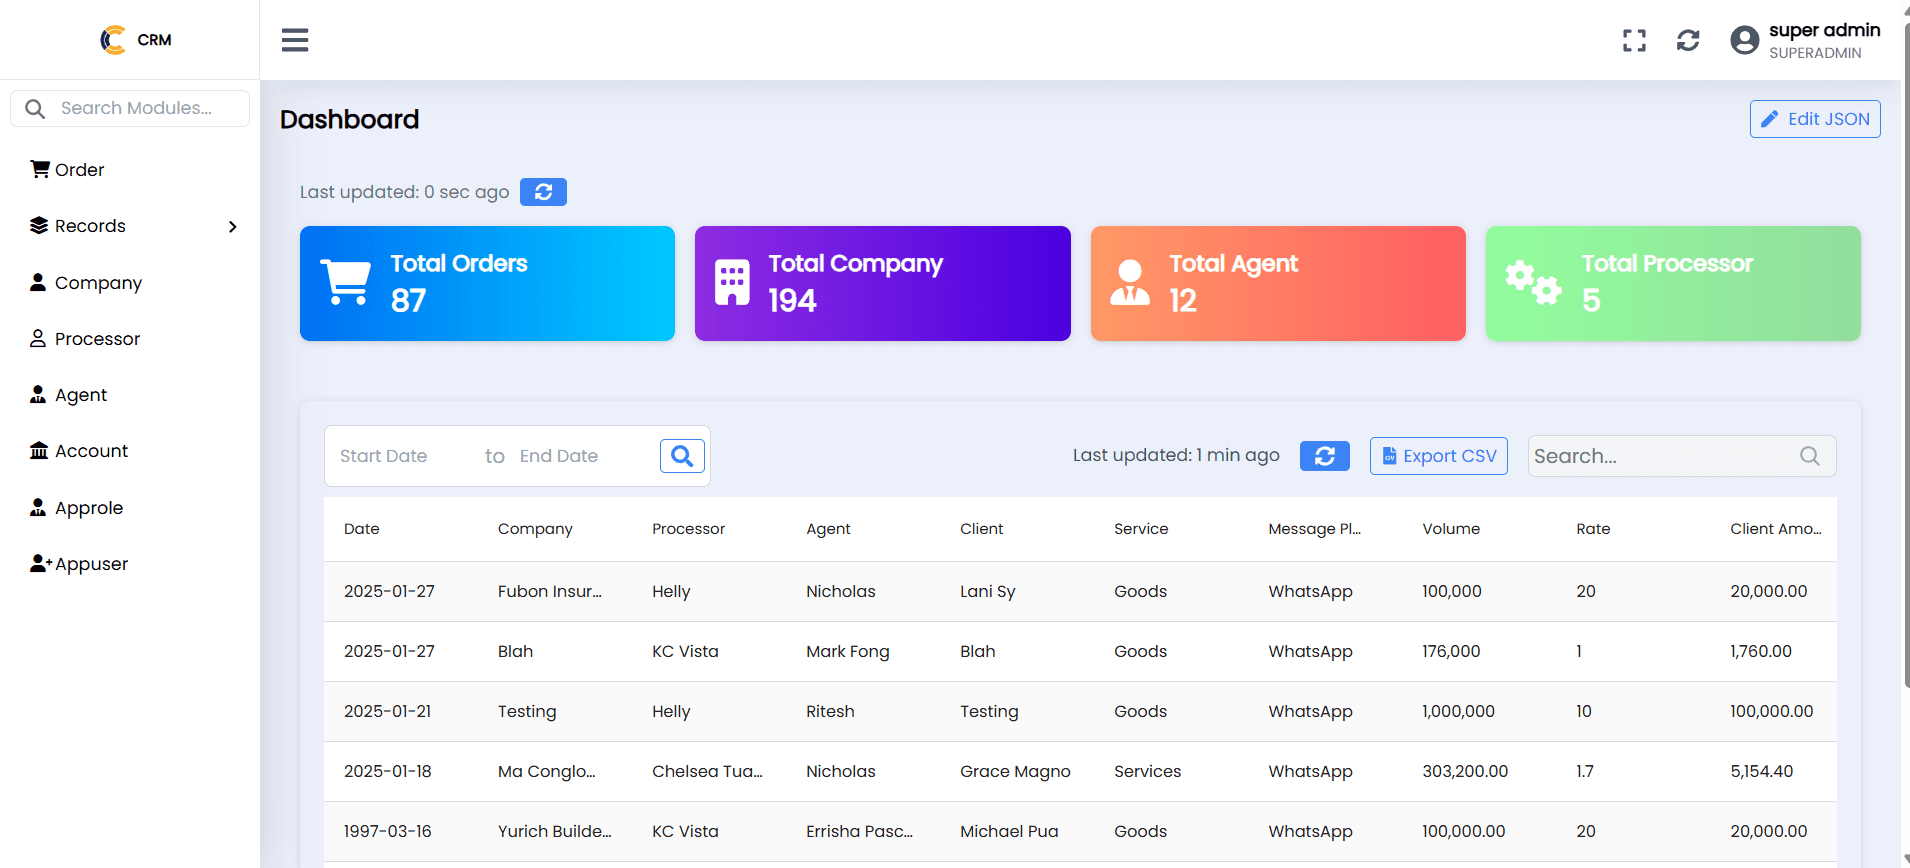
taipei crm
Manage customers and leads in one simple place.


A lightweight CRM module built within HANA to manage contacts, pipelines, notes, and follow-ups—all customizable via JSON.
Lead & Contact Management
Users can create, assign, and follow up on leads with a centralized dashboard configured entirely through dynamic JSON structures.
User Role Access
Admins, managers, and sales reps see customized dashboards based on permissions, improving productivity and data security.
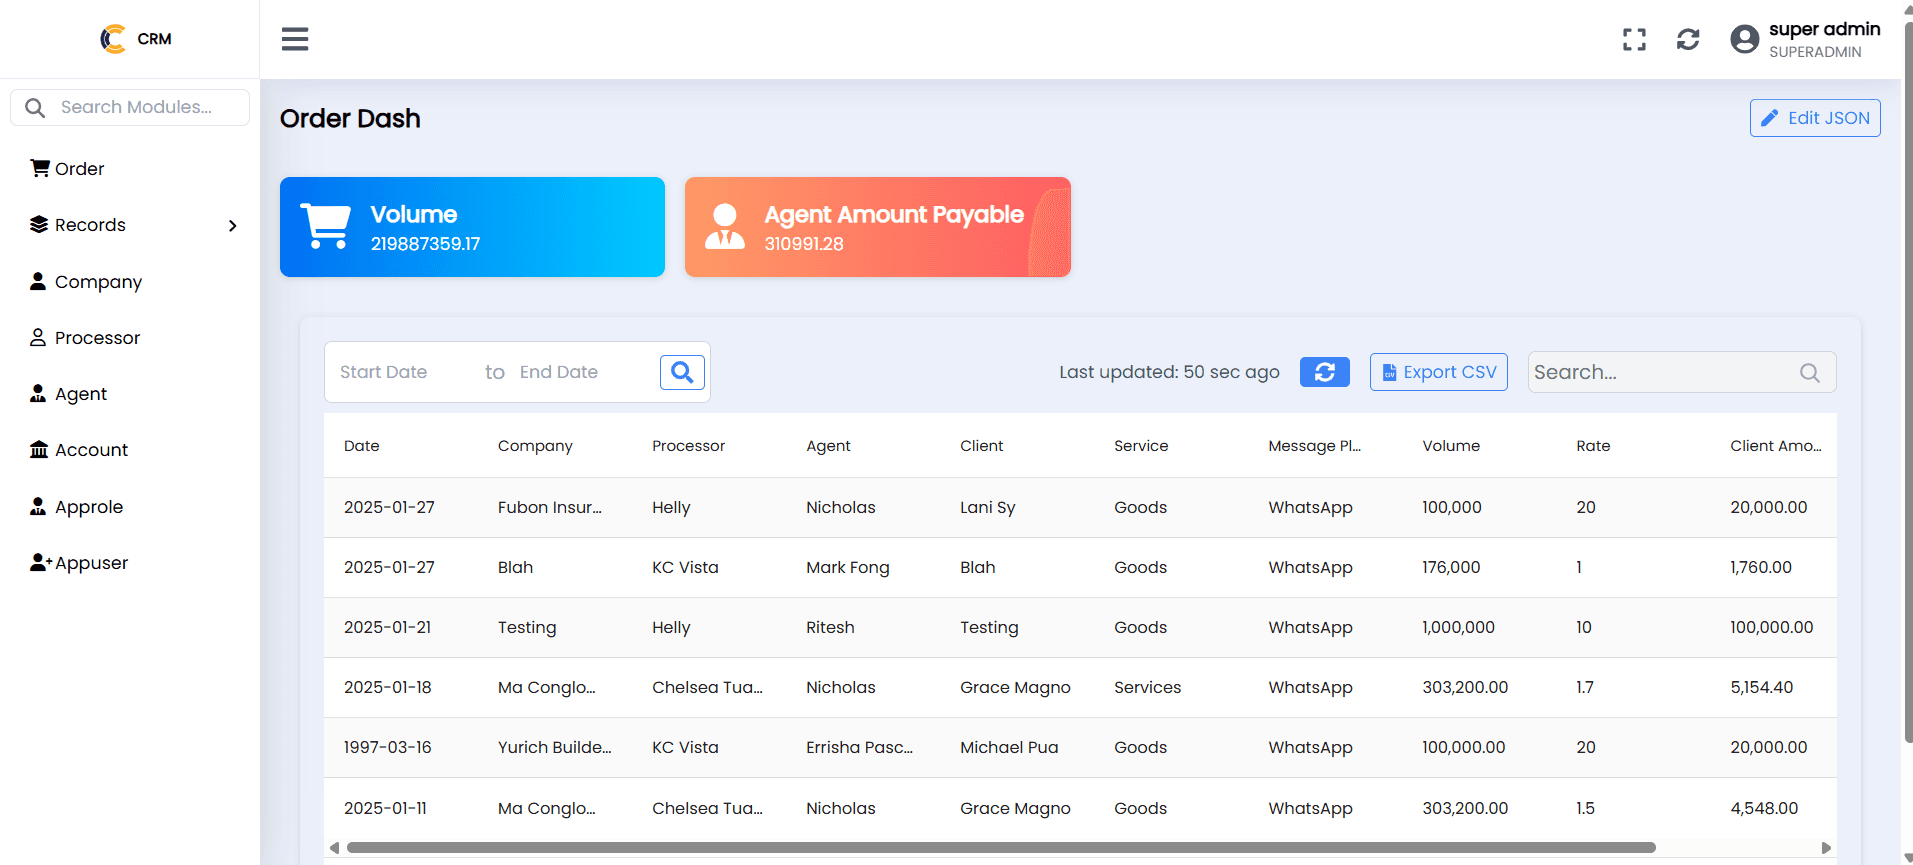
Workflow Automation
Streamlines sales activities like notes, tasks, and deal tracking to keep team progress visible and organized at all times.
Built on HANA Engine
Integrated directly into the HANA platform using MERN stack to enable rapid setup and reuse across multiple client accounts.
Building a Flexible and Dynamic Map Interface
Interactive Drawing Engine
Built drawing tools to plot points, lines, and polygons with area, distance, and diameter calculations in real-time.
Layer Configuration from JSON
All layer settings (source, style, clustering) are configured via JSON, enabling reusability across multiple use cases.
Popup and Filter Logic
Implemented attribute-based filtering, popups for feature properties, and overlays for labels dynamically based on zoom level.
UI for Map Management
Created modals for managing map layers, base maps, legends, and drawing tools for admin configuration.
Bringing Geospatial Intelligence to Business Dashboards
Data-Driven Decision Making
Enables users to visualize geospatial patterns and conduct analysis for CRM, logistics, or planning use cases.
Customizable Map Layers
Each module or client can have their own map configuration and data layers with zero code change.
Seamless File Integration
Supports uploading and parsing of GIS file formats like KMZ, KML, GeoJSON, and Shape directly into the map view.
Real-Time Drawing & Saving
Users can draw on maps, attach metadata (name/description), and save to the backend as structured GeoJSON.

Live, Scalable, and Used Across Modules
Multi-Industry Use Cases
Currently used for visualizing drainage networks, field-level event plotting, zone-wise tagging, and more.
Client-Specific Map Dashboards
Tailored for multiple businesses using the same codebase but different map setups based on need.
Intuitive and Fast Performance
Users can easily interact with the map interface without any GIS background, improving adoption.