hana geospatial platform
Draw, explore, and manage maps easily.


Interactive Web GIS Platform Built on MERN Stack
Geospatial Mapping System
GIS in HANA is a full-featured geospatial platform allowing users to visualize, draw, and analyze spatial data on interactive maps.
Dynamic Layer Management
Users can add, edit, or remove vector/raster layers dynamically with grouped controls and configuration from JSON.
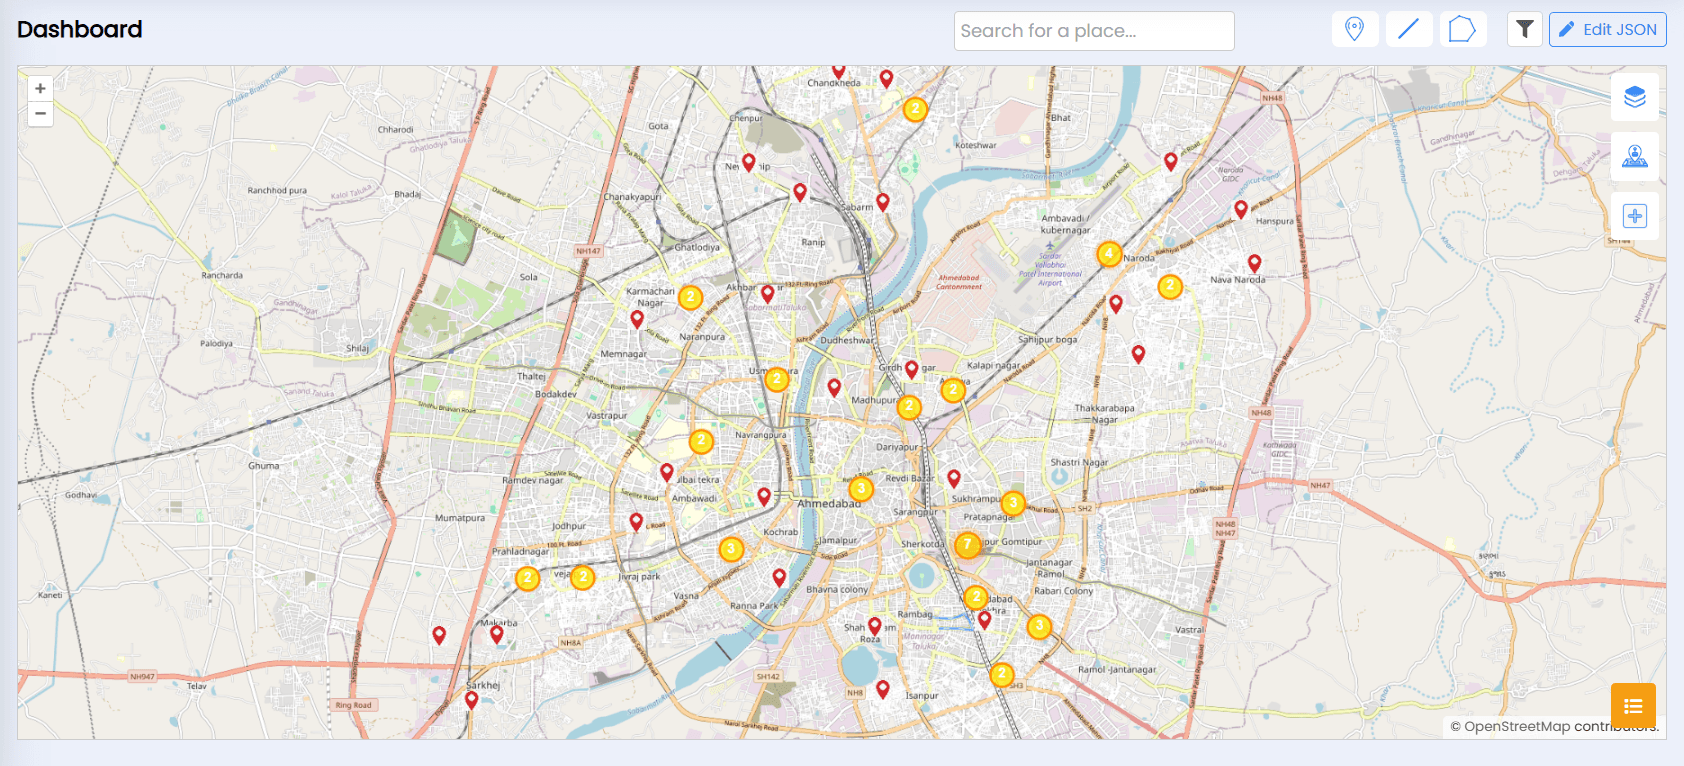
Powerful Map Tools
Tools include search, zoom, polygon/line/point drawing, basemap switching, and pop-up feature insights.
OpenLayers Integration
Leveraged OpenLayers library for rendering maps, handling spatial features, and supporting KML/GeoJSON/Shape/KMZ file formats.
Building a Flexible and Dynamic Map Interface
Interactive Drawing Engine
Built drawing tools to plot points, lines, and polygons with area, distance, and diameter calculations in real-time.
Layer Configuration from JSON
All layer settings (source, style, clustering) are configured via JSON, enabling reusability across multiple use cases.
Popup and Filter Logic
Implemented attribute-based filtering, popups for feature properties, and overlays for labels dynamically based on zoom level.
UI for Map Management
Created modals for managing map layers, base maps, legends, and drawing tools for admin configuration.
Bringing Geospatial Intelligence to Business Dashboards
Data-Driven Decision Making
Enables users to visualize geospatial patterns and conduct analysis for CRM, logistics, or planning use cases.
Customizable Map Layers
Each module or client can have their own map configuration and data layers with zero code change.
Seamless File Integration
Supports uploading and parsing of GIS file formats like KMZ, KML, GeoJSON, and Shape directly into the map view.
Real-Time Drawing & Saving
Users can draw on maps, attach metadata (name/description), and save to the backend as structured GeoJSON.

Live, Scalable, and Used Across Modules
Multi-Industry Use Cases
Currently used for visualizing drainage networks, field-level event plotting, zone-wise tagging, and more.
Client-Specific Map Dashboards
Tailored for multiple businesses using the same codebase but different map setups based on need.
Intuitive and Fast Performance
Users can easily interact with the map interface without any GIS background, improving adoption.